Blog ·
6 min read
Price/performance agent workloads
Measuring agent jobs exposed an unreliable summary judge; pairwise comparisons and deterministic checks give a more careful basis for model choices.
I started measuring agent workloads because picking a model by reputation doesn’t tell me what it will cost to get a particular job done. A memory curator deciding whether two notes are duplicates has a different failure mode from an agent extracting fields into JSON. A video summary can look convincing while leaving out the important part.
So I built an eval harness into AgentKeel, the Python client underneath my agent projects. I wanted to compare quality, cost and latency for those actual jobs. The most useful result turned out to be a problem with how I was measuring quality.
Measuring the jobs
The harness has three suites: duplicate detection over labelled memory pairs, structured extraction with schema and field checks, and video summarization scored by an LLM judge. The first two have deterministic answers. They don’t need a judge-human agreement statistic.
Summarization does. The judge scores coverage, faithfulness, conciseness and structure on a 1–5 scale, which the report normalizes to 0–1. I checked its scores against blind human labels before treating them as a useful signal.
The main sweep ran on 2026-07-11, with four models: DeepSeek V4 Flash, DeepSeek V4 Pro, Nemotron 3 Ultra’s free endpoint and MiMo v2.5. It used one sample per task at temperature 0. Generation and judging together cost about $0.16. That’s a small experiment, and the results below are a snapshot of those runs, not a current price guide.
The judge was the bottleneck
On short transcripts, the judge’s median was 5/5. Agreement with the human labels was poor: Cohen’s κ was −0.216. A near-perfect score wasn’t telling me that all the summaries were good; it was telling me that the judge wasn’t distinguishing them usefully.
Longer transcripts didn’t solve it. The median stayed at 5/5, and faithfulness was never docked in that run. Making the input harder hadn’t fixed the measurement.
A stricter rubric did spread the scores out. The standard deviation increased from 0.22 to 0.80 on the five-point scale, and all four dimensions received deductions. But on all six pass/fail disagreements, the judge passed an answer the human failed. κ reached only +0.122.
My intended calibration gate was κ ≥ 0.4. It did not pass. The stricter rubric helped expose differences, but it didn’t make the absolute scores a calibrated quality measure.
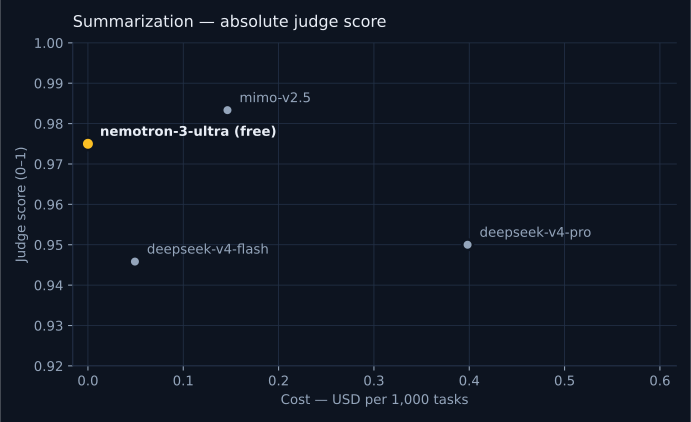
That matters when reading the first chart. MiMo has the highest absolute summary score, 0.983, while Nemotron scores 0.975 at no provider-reported generation cost. Those numbers look precise. The calibration says to be cautious about what they mean.
Comparing summaries directly
I then changed the question to which of two summaries was better. The pairwise study used two judges, showed each pair in both display orders, and aggregated the comparisons into a Bradley–Terry ranking. The stored analysis covers 30 pairs, excluding the keynote task.
The judges’ ranking correlation was ρ = 0.40. They avoided directly contradicting each other on 90% of pairs, although that includes cases where one judge chose a tie. Their exact verdict agreement was only 46.7%, so 90% should not be read as agreement on the winner.
Changing display order flipped the verdict on about 20–23% of comparisons. Checking both orders made that sensitivity visible; it didn’t make the judges immune to position bias.
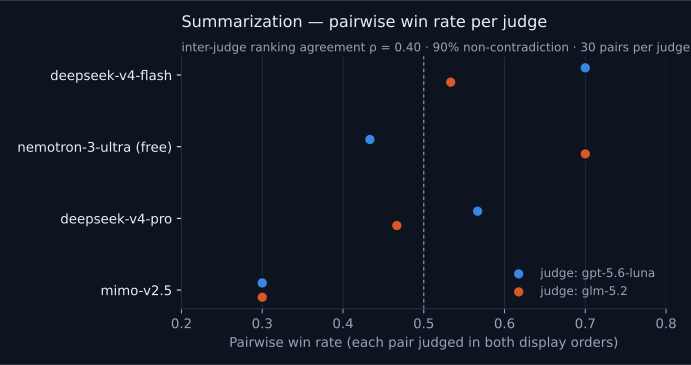
Both judges put MiMo last, with a win rate of 0.30. That is the opposite of what its leading absolute score suggests. The judges differ on the ordering of the other models, so I wouldn’t claim a clear quality winner among them from this study.
For my next runs, Nemotron’s free endpoint was a reasonable candidate. That’s a provisional choice from a small comparison, not proof that the calibration problem has been solved.
JSON and duplicate detection
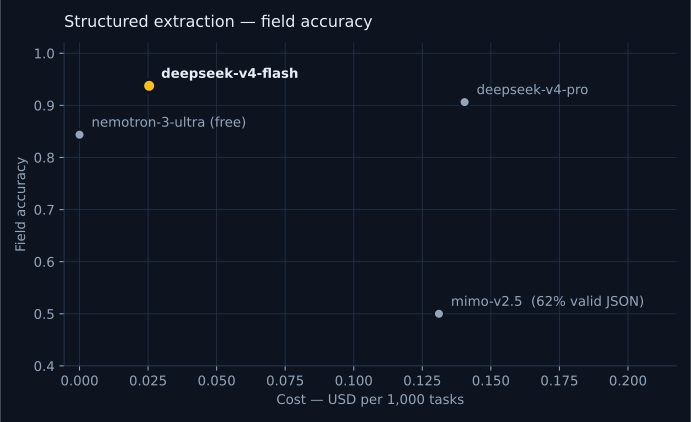
The structured suite gave a more direct answer. Schema-valid JSON ranged from about 62% for MiMo to 100% for the other models. Field accuracy still varied even when the JSON was valid: Nemotron reached 0.844, while Flash reached 0.938 at $0.025 per 1,000 tasks. Free valid JSON and correct field extraction aren’t the same result.
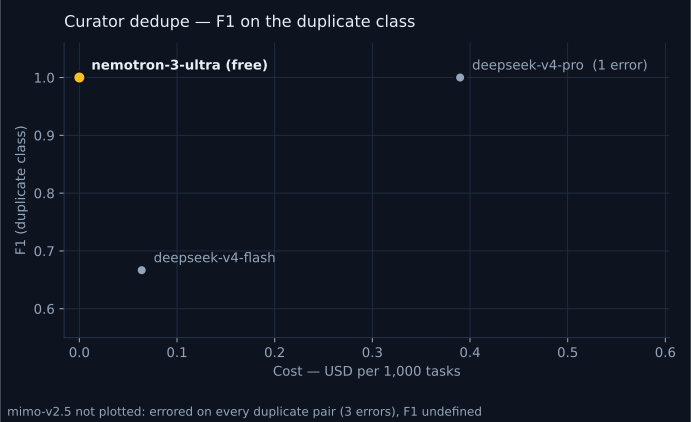
For duplicate detection, Nemotron reached F1 1.000. Pro also reached 1.000 on its answered pairs, but errored on one pair. Flash reached 0.667, with precision 1.00 and recall 0.50: it labelled only one of the two true duplicates as a duplicate, called the other “overlapping”, and also called one distinct pair “overlapping”.
MiMo failed to produce valid JSON on every duplicate or overlap pair. The report’s empty-denominator defaults produce a misleading score when only distinct pairs remain. I leave its F1 undefined in the chart rather than count those failures as success.
Latency also changed the picture. MiMo was 4.9–9.5× slower than the fastest model in each suite: 4.9× for dedupe, 9.5× for structured extraction and 7.2× for summarization. A token price alone wouldn’t have shown that.
What I would use from this run
This is the report’s recommendation table, with the quality gap shown as the amount below the best. Summary quality here is still the absolute judge score; the pairwise study above is the reason to treat that row as provisional.
| Agent job | Recommended model | Quality | Δ vs best | $/1k tasks |
|---|---|---|---|---|
| vidsavant-summarize | nvidia/nemotron-3-ultra-550b-a55b:free |
0.975 | −0.008 | $0.000 |
| curator-dedupe | nvidia/nemotron-3-ultra-550b-a55b:free |
1.000 | 0.000 | $0.000 |
| structured tasks | deepseek/deepseek-v4-flash |
0.938 | 0.000 | $0.025 |
The costs are generation costs normalized per 1,000 tasks, not a bill for running that many tasks. The free endpoint’s recorded cost doesn’t remove questions about availability or operational fit.
There are limits beyond the judge. One sample per task doesn’t measure run-to-run variance. The short-suite goldens are still marked approved: false, and the longer suite also contains unapproved goldens. I can’t describe either suite as fully human-approved.
What I take from this is the need to check the instrument before optimizing against its output. That’s familiar territory from physics: a precise-looking result is only useful if I understand what the measurement can distinguish.
Routing has since shipped in AgentBosun, where I can compare the cost of policies against solved tasks. Next I want to finish the golden review, measure repeated runs, and bring locally trained models into the same harness. The comparison should get better as the evidence gets better.